(Also, how to deal with leverage points when doing linear regression)
If you closely follow FiveThirtyEight’s politics coverage, like I do, there are some mantras you hear repeatedly. One of the most common is: general election polls are meaningless until the election starts getting close. See for instance A Year Out, Ignore General Election Polls; this article with the subheading “Early general-election polls are usually way off the mark”; and the profanely titled article Should We Take These Early General Election Polls Seriously? $#!% No! from earlier this year.
As evidence, FiveThirtyEight presents this table:
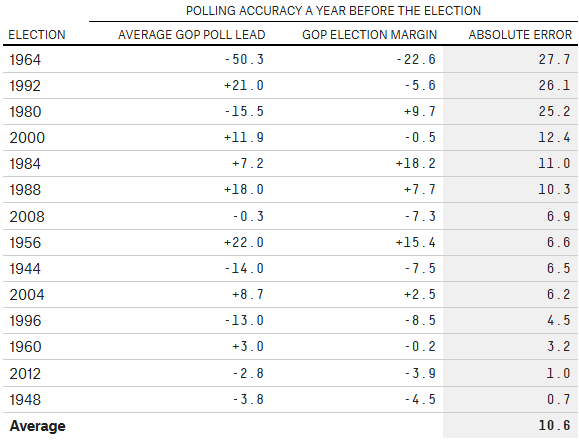
To summarize the argument: “The average year-out general election poll misses the outcome by almost 11 points. That’s terrible accuracy — polls would have predicted Bush to beat Clinton in a landslide in 1992, and Carter to bet Reagan in a landslide in 1980. So much can change in a year that one-year-out polls are not worth looking at — they aren’t remotely predictive.”
The problem with this analysis is that it’s at best woefully incomplete, and at worst entirely incorrect. All FiveThirtyEight has managed to argue is that year-out polls are a noisy predictor — that you can’t figure out precisely what’s going to happen in the next election from looking at year-out polls. But that doesn’t mean they are useless!
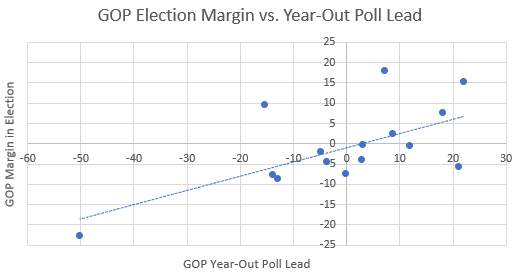
Let’s actually plot the above data: average GOP lead in year-out polls on the x-axis, eventual GOP margin in the election on the y-axis.
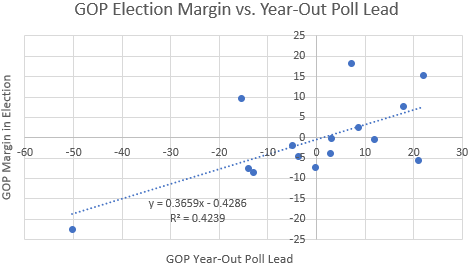
This chart tells a much more complete story. Yes, some residuals off of the line of best fit are quite large, but year-out polls tell you a lot: they explain a whopping 42% of the variance in general election outcomes! The data suggests that if you’re ahead by 10 points in year-out polls, you’re expected to win the popular vote by about 3.7 points.1
Now, this analysis is a little sloppy because there’s a huge leverage point (outlier) on the left side of the graph (the 1964 election, where Johnson beat Golwater in a landslide, but not quite the landslide that year-out polls predicted). Let’s get rid of it.
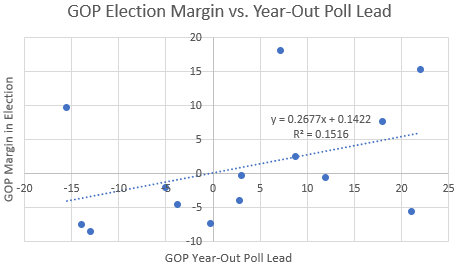
This is a lot less impressive, but there’s still a nontrivial correlation! If we think the outlier is meaningless then year-out polls explain 15% of the variance in general election outcomes, which is still reasonably large (about twice as large as you’d expect by chance with this many datapoints). Based on this analysis, a 10-point lead in year-out polls predicts about a 2.7-point popular vote win on election day.2
Regardless of whether you think the datapoint from 1964 should be thrown out, there seems to be a nontrivial correlation between year-out polls and the eventual general election result, contrary to what FiveThirtyEight would have you believe.
***
This raises a natural question about the 2020 election: are Democrats more likely to win the election if they nominate someone who’s dong better in head-to-head polls against Trump?
That’s a really hard question to answer; it does not follow from the above analysis that the answer is yes. This is because the correlation we found could be based entirely on “fundamentals” (how well people are doing overall) and the contemporary president’s popularity, rather than on the specific non-incumbent candidates involved in the race for president. For example, maybe the years when the GOP has a substantial year-out polling lead are the ones where there is a GOP incumbent and a strong economy, or when there is an unpopular Democratic incumbent. Such factors are somewhat likely to persist over the course of one year, and it is possible that the correlation we see is entirely due to these factors.
On the other hand, maybe the correlation is not due to these fundamentals, but rather the specific people running for president. That is, maybe the correlation exists because of the popularity (or lack thereof) of the non-incumbents in the race. For instance, if Demi the Democrat is polling better than Rebecca the Republican (and neither of them are the incumbent), maybe that’s because Demi is more popular/likeable than Rebecca (and if she’s more likeable one year before the election, she is probably also more likeable a year later as well, in expectation). Similarly, if Rebecca is the incumbent Republican president, we’d still expect Demi’s polling margin over Rebecca (positive or negative) to be larger if Demi is more popular.
To be more specific, we could ask why Joe Biden is beating Donald Trump by 8 percentage points in an average of head-to-head polls (as of this writing), while Bernie Sanders is only beating Trump by 5 percentage points. Biden and Sanders are about equally well-known nationally, so this difference is unlikely to be due to name recognition. If you believe the “specific candidates” theory of the correlation, you should take this polling difference as a sign that Biden is more likely to win against Trump than Sanders is. If you believe the “fundamentals” story, then you should see it as an encouraging sign for Democrats that their candidates are generally ahead of Trump, but you shouldn’t read too much into the fact that Biden is doing better than Sanders in head-to-head polls.
To me, the “fundamentals” theory seems a bit more compelling: Americans are already familiar with Trump; their opinion on him is generally set in stone. Similarly, voters have a general sense of how the economy is doing (or at least how well off they are personally, which is on aggregate is a measure of the overall economy). On the other hand, voters are just starting to tune into the 2020 race for president, and their opinions of the other candidates in the race are malleable. If I were to guess, I’d say the correlation is due 75% to fundamentals and 25% to the specific non-incumbent candidates in the race.
Going off of this guess, Biden’s 3-point advantage over Sanders in head-to-head polls against Trump translates to about a 0.2 to 0.25 point advantage in the general election, in expectation. This isn’t nothing, but it’s pretty small — perhaps a low- to mid-single-digit percentage difference in the probability of beating Trump.
Overall, I’d recommend not to pay too much attention to head-to-head polls against Trump when judging the electability of various Democratic candidates (for now). The predictive power of these polls is likely dominated by more firm conclusions about electability that political scientists have drawn: that moderate candidates are more electable, and that candidates who outperform the partisan lean of their state/district elections for lower offices are more electable. (Amy Klobuchar does really well by these metrics.)
(EDIT 2/1/2020: I’ve rethought this conclusion and now believe that polling advantages in the same cycle — as Biden’s is relative to Sanders’ — is more predictive; my new belief is that Biden’s 3-point advantage in year-out polls translates to about a 1 point advantage in the general election. Briefly, that’s because when looking at polls in the same cycle, the fundamentals are the same, which means that a much larger fraction of the variance between different candidates’ poll results is due to the candidates themselves, as compared with the variance between candidates’ poll results across different elections. I intend to come back to this and write a longer explanation.)
***
Let’s turn our attention back to the two scatter plots in the first section of this post. In the first scatter plot, we got a very strong correlation; when we threw out the leverage point, we got a much weaker one. Can we reconcile these two approaches?
To do so, let’s try to understand why we might want to throw out leverage points in the first place. Let’s extend the second line of best fit above — the one we got by ignoring the 1964 datapoint — and see how it would have predicted the 1964 election.
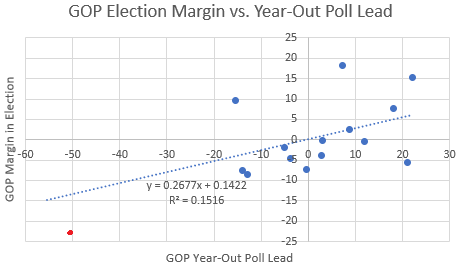
We would have predicted that Johnson would win in 1964 not by 23 points but by 13 — a pretty big miss. Now, since the line of best fit minimizes the sum of the squares of residuals (which punishes large residuals a lot), including an extra point that is poorly predicted by the line we have will change the line of best fit considerably. Plus, the fact that the x-value is an outlier means that the slope of the line will change a lot (whereas if the x-value were somewhere in the middle then we’d mainly just expect the y-intercept of the line to change). The rationale given for throwing out leverage points is that they might skew your line of best fit in a way that’s counterproductive to predicting responders for “normal” predictor values.
This rationale rests on a crucial intuition: leverage points behave differently in a way that breaks the assumptions we normally make when doing linear regression. Indeed, suppose that weren’t true: suppose you knew for a fact that all of the data — including the leverage point — has a linear fit with independent, normally distributed residuals of equal variance. Then there would be no reason to throw out any leverage points: a leverage point is just as valuable in determining the “ground truth” linear relationship as any other point. The correct line to pick is the line that surprises you the least, and that’s precisely the line that minimizes the sum of the squares of all residuals.
But if you’re skeptical of some of these assumptions, then it does make sense to treat leverage points differently. Maybe you think the true relationship of the data isn’t linear. In that case, it might still make sense to do a linear fit (because linear models have few degrees of freedom so it’s hard to overfit) — but not if your data has x-values that are outliers. That’s because while basically any curve you might want to fit to your data is locally linear (i.e. looks like a line when you zoom in enough), a linear fit might be terrible for points that are far away from your main cluster of data.
I think, though, that this is not what’s going on with our data. A linear model seems quite reasonable here, even for far-out points. Instead, the assumption that our specific data breaks is homoscedasticity: that residuals from the ground-truth line of best fit have the same variance, regardless of the value of the predictor. In particular, it is reasonable to expect that when polls aren’t close, it’s harder to precisely predict the eventual general election result.3
But how are we supposed to find a line of best fit if we reject the assumption of homoscedasticity? I wrote about that just last week!
I decided on the following model for the residuals off of the line of best fit: they are normally distributed with standard deviation 


With this model for residuals, we want to minimize the sum of 


That is, a ten-point difference in year-out polls predicts a 


Additionally, it might make sense to force the line through zero, since there’s probably no reason to think that Republicans systematically overperform or underperform year-out polls. If you do that, you get the line 
In conclusion, I believe that year-out polls do meaningfully predict presidential election results. In particular, if a candidate is up ten points in polls a year from the election, the candidate will in expectation win the popular vote by about
This is quite different from the conventional wisdom among experts, who think that the true slope of the line is much closer to zero. I would be interested to hear someone like Nate Silver respond to this analysis; I’d like to know what the crux of our disagreement is, so that we could work toward resolving it.
1. I wouldn’t read anything into the y-intercept of the line: there’s no reason to think that Republicans systematically do better or worse in year-out polls than in elections. If you force the line through zero, you get essentially the same slope.↩
2. Does it make sense to believe that there is a correlation, rather than us just getting a correlation by chance out of noise? If there were no correlation, the probability of getting such a strong positive correlation is about 0.084 (under the usual normality assumptions). This is a low-enough number that the correlation probably isn’t just due to chance: I think the reasonable prior to have is that there’s some sort of positive correlation — perhaps small, perhaps large — so this data isn’t surprising to me and I’m inclined to believe the correlation it suggests.↩
3. There are a few reasons why I believe this. First, polls being close are a sign of a polarized electorate, which means there’s less room for people to change their minds. Second, it is in practice the case that polls are much more accurate in close races (even if you account for the fact that close races have more polls).↩
4. My first thought was that the standard deviation should grow linearly with 


Okay, but how did I get the number 


![[-3, 3]](https://s0.wp.com/latex.php?latex=%5B-3%2C+3%5D&bg=ffffff&fg=000000&s=0&c=20201002)
![[0, 12]](https://s0.wp.com/latex.php?latex=%5B0%2C+12%5D&bg=ffffff&fg=000000&s=0&c=20201002)


The reason I decided to use my intuition rather than the data to determine 
5. If you don’t trust my choice of 


2 thoughts on “General election polls *are* predictive one year out”