[Edit: I no longer stand by the conclusions of this post. For more, see “How much do you believe your results?“]
In 2012, Nate Silver wrote about elastic and inelastic states. An elastic state is one with lots of swing voters. This means that if the national electorate shifted by one percentage point, you would expect that state’s vote to shift by more than one percentage point. Alaska, for instance, is an elastic state: although it is a solidly red state, its vote count swings more than most states’ from election to election. Mississippi, on the other hand, is an inelastic state: compared to most other states, the Republican candidate gets a pretty consistent percentage of the state’s vote from election to election.
FiveThirtyEight has pioneered a very useful tool that they call the elasticity index: a quantitative measure of how elastic the fifty states (and D.C.) are. A state is defined to have elasticity 


The scores work by modeling the likelihood of an individual voter having voted Democratic or Republican for Congress, based on a series of characteristics related to their demographic (race, religion, etc.) and political (Democrat, Republican, independent, liberal, conservative, etc.) identity. We then estimate how much that probability would change based on a shift in the national political environment. The principle is that voters at the extreme end of the spectrum — those who have close to a 0 percent or a 100 percent chance of voting for one of the parties, based on our analysis — don’t swing as much as those in the middle.
Per the elasticity index, the most elastic state is Alaska (elasticity 


Interestingly, the 2012 version of the elasticity index had a much wider spread: the highest index was 


I’m not sure whether FiveThirtyEight’s methodology changed or whether their methods gave much tighter numbers in 2018 than they did in 2012, but I decided to investigate. Is the 2018 elasticity index is too tightly concentrated? Is the 2012 elasticity index not concentrated tightly enough? Or is something else going on?
Here was my basic plan: the overall national vote varies from election to election. In 2008, Obama (D) beat McCain (R) by 


I did this analysis and the slope turned out to be 
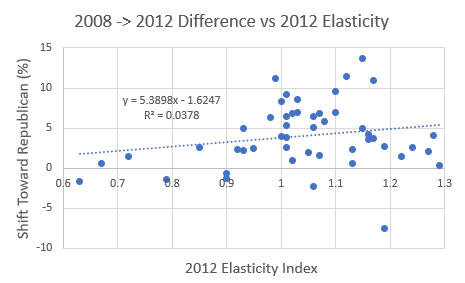
The 
![[-2.6, 13.4]](https://s0.wp.com/latex.php?latex=%5B-2.6%2C+13.4%5D&bg=ffffff&fg=000000&s=0&c=20201002)
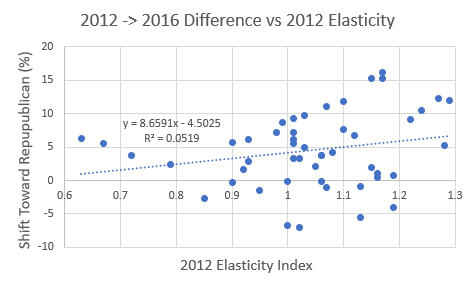
In 2016, Clinton (D) beat Trump (R) by 


![[-2.2, 19.5]](https://s0.wp.com/latex.php?latex=%5B-2.2%2C+19.5%5D&bg=ffffff&fg=000000&s=0&c=20201002)
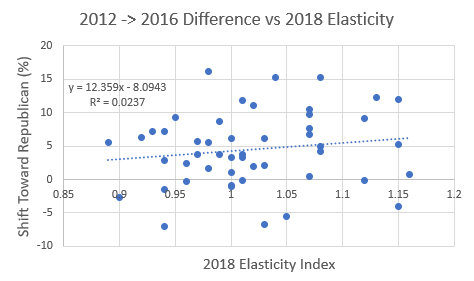
I also did this for the shift from 2012 to 2016 using the 2018 elasticity index. I got a slope of 
![[-10.9, 35.87]](https://s0.wp.com/latex.php?latex=%5B-10.9%2C+35.87%5D&bg=ffffff&fg=000000&s=0&c=20201002)
We thus have a few weak indications that FiveThirtyEight’s elasticity index may not be wide enough. I have one final piece of evidence to offer, which is state-by-state shifts in Donald Trump’s popularity since the 2016 election. I considered the percentage of people who voted for Trump in 2016 and compared it with Trump’s current approval ratings, as estimated by Civiqs.5 The second measure was broadly lower (on average by about 


![[-9, -50]](https://s0.wp.com/latex.php?latex=%5B-9%2C+-50%5D&bg=ffffff&fg=000000&s=0&c=20201002)
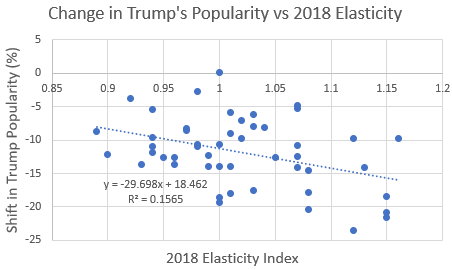
On the surface this seems like decent evidence that the elasticity index isn’t wide enough. I think it’s actually only weak evidence, for a few reasons. First, Trump’s current approval rating is an imperfect measure of how we would expect him to do in a general election, even against a fairly popular Democrat. Second, it seems to me that Civiqs’ model of Trump’s approval ratings and FiveThirtyEight’s method of generating the elasticity index are similar in nature. This might make the popularity-shift numbers and the elasticity numbers might artificially well-correlated. Third, shifts in Trump’s approval rating correlate between demographically and geographically similar states, which makes the above confidence interval too narrow (this applies to the earlier confidence intervals as well). So all in all, I’d say we have several pieces of weak evidence that FiveThirtyEight’s elasticity index is too narrow.
Taken together, do these weak pieces of evidence constitute strong evidence? I’m not comfortable asserting that they do, especially because I trust FiveThirtyEight to put a lot of thought into things like elasticity. But at a minimum, I’m willing to suggest that the index may be too narrow and encourage others to look into this. If you find anything interesting, let me know!
1. I decided to look at presidential rather than congressional election results because lots of congressional races are uncontested and this messes with percentages. I think accounting for this and using congressional results would make for a better, more thorough analysis, but I’m not sure how to do that. If anyone does this analysis, I’d be interested in seeing the results.↩
2. I threw out Washington, D.C. from my analysis because it was a leverage point, as well as Utah, because it behaved weirdly in both the 2012 and 2016 elections (2012 because Romney was a Mormon and 2016 because Evan McMullin received a large fraction of the conservative vote).↩
3. This confidence interval is accurate only if some assumptions are made: the underlying data is linear; the y-values are normally distributed with the same standard deviation; and residuals are uncorrelated. I’m not entirely comfortable with the last of these assumptions — states that are demographically similar and in the same region tend to have correlated shifts — but I think the interval is not terribly off.↩
4. Take this evidence with a grain of salt, since calculation of the 2018 indices may have been partly based on the shift from 2012 to 2016.↩
5. Elasticity is intended to model shifts in how people vote between elections, not shifts in popularity. However, I think Trump’s approval rating is a pretty good proxy for how much of the vote he would get against a reasonably popular, Obama-type Democrat.↩
6. As before, I have excluded Washington, D.C. and Utah.↩
